From digital effort to faster innovation
You saw the potential of digital to accelerate innovation early on. You hired a digital leader, and perhaps even a digital unit. You likely have a portfolio of digital initiatives, some of which are showing promising results. But the acceleration that you hoped for hasn't materialized yet. So what is going on?
My credentials: 25 years across McKinsey, Unilever, building FrieslandCampina's Digital R&D function from scratch, and six years in the trenches with deep first hand data and analytics experience — now advising R&D leaders through Decodexis, and building software solution Augmend, a LLM-driven tool that turns messy R&D data into a structured foundation for automation and prediction.
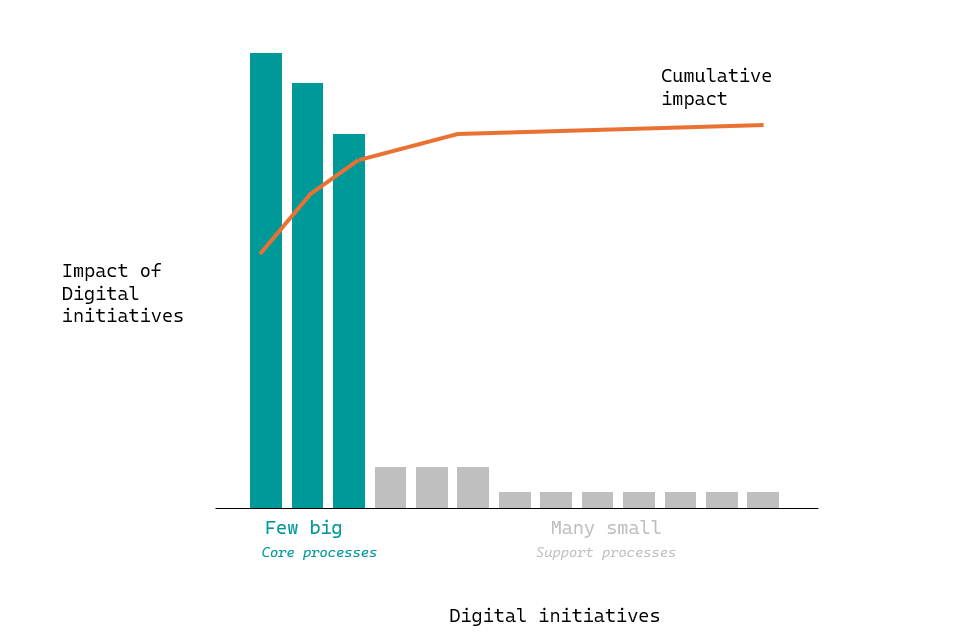
Digital initiatives' impact follows a Pareto curve
In any organisation, R&D included, a handful of digital initiatives account for most of the value. They are the ones that touch the core process. For many R&D organisations, that's turning prototypes into working products (or leads into hits if you prefer). Other digital initiatives act on the smaller but numerous support processes around the core, which is why they individually do not move the needle as much. Both type of initiatives matter but they just create impact in different ways. So how is digital impact affected by this?
Four areas blocking your digital impact
Look in four areas to diagnose why you're missing impact. Two relate directly to the few big and many small initiative types in the Pareto curve; the other two are foundational.
Make useful work repeatable
If this bottleneck of needing a digital expert sounds familiar, you are likely accumulating initiatives faster than you can support them. Digital or IT becomes the bottleneck. The cost of maintaining everything already built keeps climbing, even as new requests pile up behind it.
This is the long tail of the Pareto curve. Individually these initiatives are useful but do not move the needle much. You need to do lots of these small initiatives to get the impact that you want.
You are looking at email approval workflows, hunting through document repositories, and drafting the first version of a summary report here. In a Microsoft shop, this is Power Platform or Copilot territory.
Then there is data provisioning, pulling internal and external data together to generate insight. This has spawned a whole cottage industry of Excel workbooks. Done properly, that is Power Query, Power BI, or an ETL flow doing the same job without the workbook sprawl.
LLMs have opened a new category on top of these. They can extract structured data out of messy, narrative sources like lab notebooks, reports, and emails. I built Augmend to handle this. Start with the article on messy lab notes, the video on why historical data stays locked up, or a live demo on shampoo-lab records. Another useful example is automatic extraction of specifications to populate your PLM database.
Agentic AI takes this further, orchestrating a whole task rather than one step in it. It only pays off once the building blocks underneath are already automated and reliable. Save it for later.
How I can help
- Portfolio assessment. A view of whether your portfolio is too biased towards the long tail of small-impact initiatives.
- Operating model design. A working line between what Digital or IT supports centrally and what teams build themselves, so new initiatives stop bottlenecking on your specialists.
From experimental to predictive R&D
If your teams still depend on trial and error for every project, you are likely spending months on work that could be shortened once your data is in order.
This bucket sits at the front end of the Pareto curve. It covers the core R&D process you run for every project: picking your ingoing ingredients, designing your prototypes, experimentally finding the best one, and scaling it up.
There are two ways to accelerate this work. The older approach relies on faster, hardware driven high throughput screening and testing. The newer approach uses predictive analytics on historical data to cut down the experimentation you need. Increasingly the two feed each other. High throughput data trains the predictive models. The models then tell you which experiments are worth running on the hardware.
Whether you use HT approaches or not, getting your historical data lined up and high data quality matters most. Once this data foundation is in place, you can build recommender engines to select ingredients, predictive models for in silico screening, and optimization algorithms to improve your whole product portfolio. What it actually takes to get there is less about modelling skill and more about whether past data was preserved, accessible, and reusable.
You are almost certainly already looking at this opportunity. What is most likely blocking you is not your modelling or machine learning capability. It is the state of your data.
How I can help
- Data readiness review. An honest read on whether your historical data is clean enough to model, and which part of the core process is closest to ready.
- Opportunity mapping. A shortlist of the pockets in your core process worth tackling first, ranked by impact and how much data work they need.
- Roadmap to in silico development. A path from your current state to recommender engines, predictive screening, and portfolio optimization, sequenced so early wins fund the later ones.
From scattered data to a foundation you can trust
This data bucket does not sit on the Pareto curve itself. It feeds both ends of it. Neither the long tail of automation initiatives nor the few big predictive bets get far without data that is solid enough to build on.
R&D organisations deal with many kinds of data: literature, IP, regulatory, consumer and customer data, product information, process data, factory data, measurement data, reports, presentations, and competitive insights. And this diversity makes it difficult to capture data effectively.
If your data is fragmented and siloed despite having dedicated systems, ask yourself a blunter question first: why doesn't the data in your systems hold up? PLM is a frequent example: the system is in place, but specifications and datasheets never make it into structured fields, so the database stays incomplete and the investment underused. How to get the best out of your PLM walks through what changes once that data is actually in the system.
The data challenges fall into three types.
This maps closely to FAIR, a framework widely used in data intensive research: Findable, Accessible, Interoperable, Reusable. Interoperability is folded into transformation above, but it is the same underlying idea.
Each challenge needs a different kind of solution. These are dominant patterns:
Many of these improvements call for data quality monitoring, solid data governance, and a change management program to make sure new ways of working actually stick.
How I can help
- Structured data extraction. Turning unstructured sources like lab notebooks, reports, and emails into structured data you can actually query and model.
- Data governance design. Governance that fits how your R&D organisation actually works, so it survives past the first six months.
- ELN selection and implementation. Choosing and rolling out the right electronic lab notebook for your organisation, including the change management to make adoption stick. Start with the one question that matters, then use the 5-bucket guide.
From scattered initiatives to one digital strategy
If your initiatives feel disconnected from each other, the missing piece is usually not another tool. It is a strategy that ties them together.
You have seen the two sets of initiatives that create impact, automation and predictive analytics. To get there, they need to be supported by good quality data and finally a holistic digital strategy, one that is aligned with business and R&D objectives and stays relevant over multiple years.
The strategy has to spell out your larger initiatives on predictive analytics, and it also needs to cover the other two buckets of automation and data. You only get the full impact once the whole organisation has adopted digital, so your digital program needs to extend beyond just technical improvements. So your strategy needs to go further still not only to include infrastructure improvements but also capability building and change management, coordinated across the entire R&D organisation. S.W.I.M. is a framework for thinking holistically about your digital efforts. For what tends to make those programmes stick after launch—roadmaps, hub and spoke, the right mix of people, and a few big bets—see the companion note.
How I can help
- Strategy and roadmap facilitation. Working directly with your leadership team, using S.W.I.M., to build a digital strategy aligned to business and R&D objectives.
- Portfolio alignment. Mapping your existing initiatives, automation, predictive, and data, against that strategy so you can see gaps and overlaps clearly.
- Change management. Auditing your existing change management efforts, and recommending improvements to drive adoption and digital impact—including whether the change is a temporary effort climb or a permanently higher baseline. See how to succeed with digital change in R&D.